State of the Merchant Report – 2017
I’m thrilled to announce the first annual State of the Merchant report!
I surveyed hundreds of store owners to understand how business is going, measure the trends shaping our industry and get a sense of how satisfied, wealthy and Amazon-dependent we are.
Read on to discover what stores have the highest conversion rates, the average net worth of an eCommerce entrepreneur and a list of the software darlings we store owners can’t get enough of.
(If you want to skip all my commentary and just get to the full info-graphic ripe with stats you can click here.)
Who Are These Store Owners?
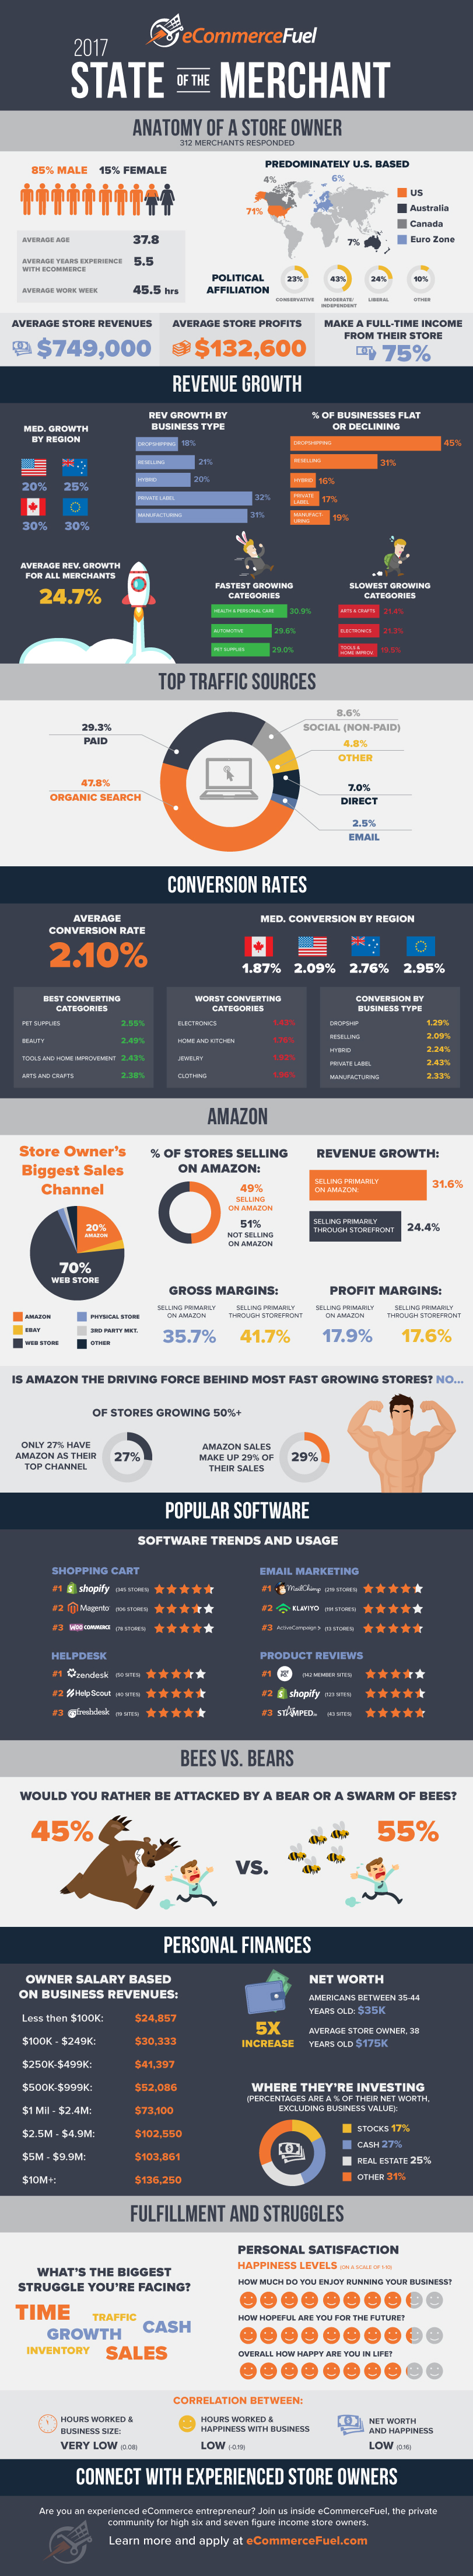
More than 300 store owners responded to the survey I sent out last fall. The majority are male, live in the U.S. and generate a full-time income from their store.
They are what I like to call “independent merchants”: entrepreneurs with meaningful businesses in the high six- and seven-figures but who aren’t large enough to be classified as “big” by most hoity-toity pundits and TV analysts. In general, they’re exactly the type of people you’d find inside our Private Community.
Here are a few more details about the group:

Who’s Growing?
Store owners in general are enjoying healthy, vibrant growth. On average, the group saw year-over-year revenue growth of 25%. Pretty impressive!
Given all the hoopla recently about “building a brand” and “the death of drop shipping,” I wanted to break down growth by business type to try to better understanding the underlying trends.
The data back up what I’d suspected. Companies that sell their own products (labeled below as “Private Label” or “Manufacturing”) are growing about 50% faster than those that don’t.
If you’re in the health, automative or pet supply space, it has likely been a good year for you. These are the three fastest-growing categories for merchants.
What stood out most to me was stores with flat or declining revenues. If a business is exclusively selling other people’s products it’s twice as likely to be flatlined or shrinking.
eCommerce in the U.S. is still pulverizing B&M retail (RIP my local Kmart), but it isn’t growing nearly as fast as in other countries. Merchants in Canada and Europe are growing 50% more quickly than those in the States.
(Click image to view full-size in a new window)

SEO is Dead, Right?!?
People have been predicting the demise of SEO for years now. I certainly think there are much more significant headwinds for SEO today than even two years ago. But when you look at the data, SEO is still a major source of traffic for store owners and an important part of the eCommerce marketing strategy.
No, scratch that.
It’s far and away the most dominant source of traffic.
Organic search was the top traffic source for nearly half of all merchants. Paid traffic (which would have been my guess for the #1 spot) came in a distant second at 29.3%.
(Click image to view full-size in a new window)

Conversion Rates
I was especially interested to see data on conversion rates, as it’s something we merchants love to compare.
The overall average conversion rate for all merchants was 2.10%. Rates ranged wildly from below 0.50% to north of 5% on the high side.
(If that’s you breaking the curve with your above 5% rate, please contact me so I can become your humble CRO apprentice.)
As before, I also wanted to break out conversion by business type and category. And the same trends we saw in revenue growth hold true: it’s far, far easier to convert visitors if you own your product.
We also see that conversion rates in Australia and Europe are about 40% higher than in the U.S. I’m speculating here, but I’d guess that’s probably due to less competition in those market versus the States.
(Click image to view full-size in a new window)

Is Amazon Our Only Hope?!
Amazon has become the major story and driving force in eCommerce (but lookout for the dangers of selling on Amazon). It’s an incredibly powerful platform and has undoubtedly been to credit for many successful businesses.
But my suspicion coming into this study was that we merchants weren’t quite as beholden to Amazon as popular opinion would lead you to believe.
I think, to some extent, that’s what the data show.
Seventy percent of respondents listed their storefront as their biggest sales channel, with Amazon making up only 6.2% of their overall revenue.
Let me repeat that.
More than two-thirds of store owners are generating only 6.2% of their sales from Amazon. That’s shockingly low for the number of loudly proclaimed Amazon success stories we hear.
On the other side of the coin, 20% of owners reported that Amazon was their primary channel making up 76% of their revenue. So it’s a fairly polarized set of results.
Perhaps Amazon-heavy merchants are driving all of the growth, while store owners who have yet to get aboard the Bezos rocketship are languishing in business purgatory?
Not quite.
Of stores growing 50%+ per year, only 27% have Amazon as their top channel. And 43% of them don’t even sell on Amazon.
Please don’t misunderstand me. I’m not trying to downplay the power or opportunity on Amazon. I genuinely do think Amazon is (and will continue to be) the biggest platform in the world for eCommerce. There’s a lot of opportunity to be had, and you discount it at your own peril.
But it’s important to emphasize that it’s not the only way to build a vibrant business in 2017. Heck, the majority of store owners (51%) aren’t even currently selling on Amazon! I think that number will definitely decrease over time, but it’s a telling stat for a group of 300+ merchants with average sales of $750K.
Bottom line? Make sure you’re thinking about Amazon and seeing if it’s right for you as a merchant. But it’s by no means the only way to build a successful business today despite its dominance. Just watch out for the most common mistakes made selling on Amazon.
(Click image to view full-size in a new window)

Popular Software
I cheated a bit on this section.
Most of the data in this report comes from our survey, but the results below are from our Community’s Software Directory. Our proprietary directory leverages BuiltWith’s API to compile a database of the software being used on the websites of our 1,000 members.
All of the rankings discussed below are based on adoption numbers. The star rating shows how store owners inside our Community have rated each tool.
(Disclosure: I’ve worked with and/or hosted events sponsored by the teams at Shopify, Klaviyo and Yotpo.)
Shopify was the undisputed leader in the shopping cart category and is used on more than a third of all members websites. Even just two years ago, I think Shopify and Magento would have been neck-and-neck. But the last few years have seen a flurry of people jump ship and migrate to Shopify.
They’ve done a really good job of offering a stable, robust platform and fostering a great ecosystem. I think it’s pretty safe to say they’re the most popular choice in the cart space for SMBs under $10 million in sales.
For email platforms, MailChimp comes in at #1 with Klaviyo a close second. Klaviyo was the first company to offer truly powerful email marketing features at a price point that made sense for independent merchants. That’s how they were able to gain such impressive adoption over a giant like MailChimp.
Until recently, I’d say that MailChimp’s adoption was primarily a result of their size vs. their feature set, at least for store owners. But in 2016 they upped their game and are offering a much more impressive suite of eCommerce tools. Once viewed as a solution primarily for run-of-the-mill newsletters, MailChimp has enticed more established store owners to give it a more serious look.
Zendesk is the most widely used help desk, but I predict fewer merchants will be using it a year from now. Zendesk is incredibly powerful, but speaking from experience, I can tell you that setting things up can quickly get complex. More and more store owners are opting instead for the simplicity of Help Scout.
Yotpo is the most well-known and used review tool, and one of the most robust in terms of features. But offerings from Stamped.io (stand-alone SaaS app) and Judge.me (Shopify app) have received a lot of interest this year due largely to their compelling price points.
(Click image to view full-size in a new window)

Gruesome Animal Attacks
The following might be the most important takeaway from this entire report:
I asked all store owners: “Would you rather be attacked by a bear or a swarm of bees?” It seemed an appropriately ridiculous question to break up a serious 50-question survey.
It turns out that people who picked the bee attack make 50% more money, although I struggled mightily to find any meaningful application of this stat to the real world.
OK, now that I’ve gotten that out of my system, let’s move on to information that’s actually useful.
(Click image to view full-size in a new window)

Personal Finances
I’m a bit of a finance geek and thought it’d be fascinating to see how the financial choices and health of store owners stacked up against others. Plus, how often do you get to pry and ask people how much they’re worth?
The average store owner’s net worth is $175K, which is approximately 5x higher than what you’d expect to see for an American between the ages of 35-44. While not a perfect comparison, I think it’s a pretty good one given our “average” store owner in the survey is a 38-year-old American.
I also asked where store owners were investing.
If you look at the average American, they have approximately 30% of their financial assets in the stock market and 15% in cash. Store owners on the other hand have almost exactly the opposite holdings: they’ve invested 17% of their money in the stock market and have 27% in cash.
It could be because entrepreneurs want/need a bigger safety cushion. Perhaps they’re reserving more funds for potential business investments and believe they can generate better returns there. Or maybe they just think the stock market is a sham.
Whatever the reason, I found the difference in allocations interesting.
If you’ve ever sat down with your accountant and tried to come up with a “reasonable salary according to IRS guidelines,” you’ll thank me for this next question. I’m not qualified to give tax advice, but the data that follow are as good a benchmark as any I’ve seen for justifying the salary you pay yourself.
(For those not familiar with this issue, many company owners struggle with where to set their salaries. The lower you set it, the more tax savings you often receive. But if you set it too low, you face potential penalties from the IRS. So coming up with a reasonable salary that can be backed up when challenged by the IRS can be difficult.)
Average salaries for store owners range from $25K on the low side to $136K for those with 8-figure stores. The full spectrum is below:
(Click image to view full-size in a new window)

Fulfillment and Struggles
Store owners may be richer than the general public, but are they happy?
It turns out, generally speaking, yes.
While I don’t have any control group for comparison, store owners rated themselves pretty high up on the scale (8’s out of 10) in terms of happiness with their lives and businesses.
Two things really stood out. First, there was almost no correlation between the number of hours an owner worked and the size of their business. This was a huge encouragement and reaffirmed that throwing more hours of work at a problem/business isn’t usually the best solution.
Second, we always hear that money can’t buy you happiness, and that old adage seemed to be supported by the data. There was very little correlation between someone’s happiness and their net worth.
Finally, store owners listed as their biggest struggles: time, growth, traffic, cash, sales and inventory.
(Click image to view full-size in a new window)

Full Data Set and Thanks
I’m making the raw data set from this survey available under an attribution, non-commercial license. As long as you reference and/or link back to eCommerceFuel, please feel free to use this data for blog posts, reports, etc.
You can download the complete data set here.
An enormous thank you to everyone who participated in the survey and those who helped spread the word. Special thanks to David Rekuc and the team at Ripen eCommerce for helping share the survey through their list and their newsletter which I highly recommend.
Also, congratulations to Kyle Gougen for winning the round-trip international plane ticket we gave away as a prize. Hope you have an epic trip, Kyle!
Here’s to a wildly successful 2017 for your store! Make sure to check back next year for the 2018 State of the Merchant.
(The 2018 State of the Merchant report has been published! You can read it right here).
Full Infographic
To Embed Use This Code:
https://www.ecommercefuel.com/wp-content/uploads/2018/03/2017-state-of-the-merchant_updated.jpg
(Click image to view full-size in a new window)