The 2018 State of the Merchant eCommerce Report
In what has become an annual tradition, I’ve once again bribed store owners to fill out a survey in order to understand how merchants are fairing in the eCommerce jungle.
It’s called The State of the Merchant and it contains details on everything from revenue growth, conversion rates, happiness levels, our favorite eccentric billionaires, how much profit (and pain) Amazon is causing and more.
If you missed last year’s edition, you can see my 2017 State of the Merchant report here.
After spending weeks neck-deep in spreadsheets, calculations and writing I’m excited to share the results with you. You can read my full analysis below or jump right to the full infographic at the end if that’s more your style.
Who Are These Store Owners?
We had over 450 store owners respond this year which was very encouraging. That’s up almost 50% from last year. The additional data points will hopefully help paint a more accurate picture.
The biggest change I noticed in demographics of those responding is that merchants were larger. The average merchant reported $2.3 million in sales, up from $1.6 million last year.
Part of this increase may be just a variation in who replied. But I think much is due to very strong growth this year and the fact that the eCommerceFuel Community (who makes up a large percentage of the respondents) is increasingly made up of larger store owners.
13% of respondents were doing more than $5 million in sales and the survey members represent a billion dollars in revenue. It’s really fun to see the size and sophistication of the sample group grow!
The field remains dominated by men with women making up only 14% of store owners. It’d be great to see this figure grow, and it can unfortunately cause issues for female entrepreneurs that guys don’t think about or have to deal with.
eCommerceFuel member Jen Geale recently wrote about an experience at our recent eCommerceFuel Live event that illustrates the point. Well worth a read and something to think about and, at a bare minimum, be aware to help combat it from happening.

A Breakout Year for Growth
2018 was a pretty phenomenal growth year for 7-figure merchants. You’d expect a younger group of eCommerce businesses to experience strong growth, but even still it was impressive.
Overall revenue growth in the broad eCommerce market is estimated to be around 23% or so annually. For merchants in our study, annual revenue growth was 36.8% – up from 24.7% in 2017.
All different types of business models saw strong growth, with private label and merchants manufacturing their own proprietary products expanding the fastest.
One segment I was especially interested to follow this year was drop shipping.
In last year’s report, I reported that 45% of drop shipping businesses reported flat or declining revenues. I’ve been bearish on drop shipping and even sold my drop shipping business 18 months ago, partially because I was worried about the business model becoming more difficult and less defensible.
Revenue growth was 36.8% – up from 24.7% in 2017.
So I was surprised to see some positive drop shipping trends year-over-year.
The average drop shipper grew at 2x the speed they did in 2017 (even when removing brand new stores from the calculation) and fewer of them have stores that are stagnating or shrinking. If drop shipping you’re still most likely to have a store that’s lackluster or struggling. But the headwinds have lessened.
I wonder how much the surging popularity of AliExpress, Oberlo and drop shipping goods directly from China has played into these trends. I’d be surprised if they weren’t influencing them in a meaningful way.
The Pet, Food, Men’s Clothing and Toys categories led the pack with staggering annual revenue growth on average above 55%. That number seems outlandish and I’d imagine that if we had a larger 5,000 store owner sample to draw from it would likely be dampened a bit.
But looking at the individual results nearly half of stores in the Pet category doubled year-over-year, with the average revenues for the group around $2.5 million. So it wasn’t just a matter of a lot of small businesses doubling from $100K to $200K and skewing the results. Growth in the category seemed very strong.
Tools and Home Improvement was the slowest growing category, clocking in at a mere 13.6% compared to the 37% overall average. Sorry, Tim Allen.

Surprisingly, Margins Hold Up
“Your margin is my opportunity” might be the most infamous quotes in all of eCommerce, coming of course from Amazon’s Jeff Bezos. So in a year where Amazon continued to gobble up market share and paid traffic costs also increased (see below) I was surprised to see very little margin erosion.
Gross margins were 39.2% on average, compared to 39.6% last year. Net margins also weren’t impacted as much as I would have suspected. They were 17.4%, down just a touch from 17.7% last year.
A small portion of this margin pressure may be offset by merchants starting to migrate to higher-margin and more defensible businesses. In 2017, 43.0% of store owners ran a private label or proprietary manufacturing business. That jumped to 45.2% this year.
In a year where Amazon continued to gobble up market share….I was surprised to see very little margin erosion.
A modest increase, although not as much of a jump as I would have expected to see and not enough to drastically offset the margin pressure from other areas. I’d speculate the strong increase in conversion rates (discussed below) were part of the reason margins held up as well as they did.
For the first year ever, I asked merchants to report their Average Order Value.
As you might suspect, manufacturers and private label stores had the lowest AOV while drop shippers had the highest. It reminds me of when I drop use to drop ship $2,500 GPS powered trolling motors. With no up-front capital costs, drop shippers are more likely to sell more expensive items which drives a higher AOV.
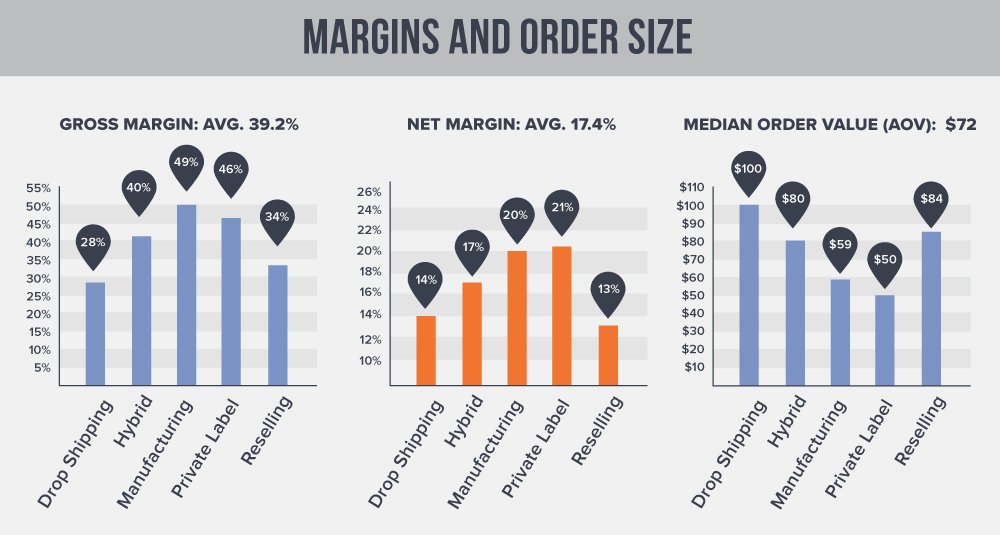
Note: While normally called Average Order Value, I used the median as number of sky-high data points (is someone selling 747s? Luxury yachts?) would have meaningfully skewed the results.
Organic Traffic Remains Top Traffic Source
It’s easy to bemoan a world in which Google, Amazon and Facebook are increasingly monetizing their platforms while shrinking the pool of organic traffic opportunities and reach.
But it turns out that for the majority of store owners, free, organic traffic is still their #1 source. In fact, more merchants reported organic as their #1 traffic source this year (51.1%) vs. last year (47.8%).
This is a shocker. I thought for sure we’d see the number of people reporting organic traffic as their top channel decline.
Merchants reported cost per acquisition on their paid channels increased almost 15%
What’s not surprising is that merchants reported cost per acquisition on their paid channels increased almost 15% over the last year. Anecdotally, I’ve been hearing from lots of different advertisers that Facebook ads having been getting increasingly expensive so this wasn’t a surprise.

Who’s Your Favorite Billionaire?
This is the part where I ask an irreverent question to have a little fun and offer respite from far too many stats.
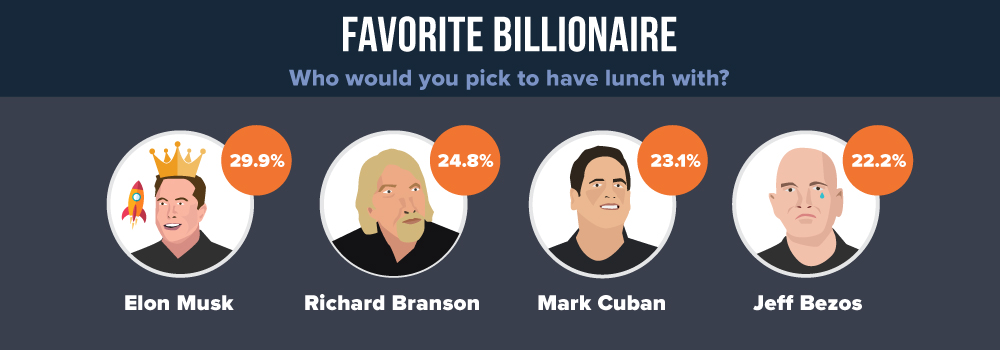
Last year we discovered that 55% of store owners would rather be attacked by a swarm of bees vs. a bear. I thought I’d be a bit less sadistic this year and ask everyone which billionaire they’d most like to have lunch with.
It turns out Elon Musk was the strong favorite.
Jeff Bezos came in last with only 22.2% of merchants opting to dine with the King of eCommerce.
Jeff Bezos surprisingly (or perhaps not so surprisingly) was last with only 22.2% of people opting to dine with the King of eCommerce. And this was before Musk and the SpaceX team pulled off a successful launch of the Falcon Heavy putting a Tesla Roadster into space.
I heard Musk likes BBQ so maybe keep that in mind when you call with that lunch invitation.
A Big Jump in Conversion
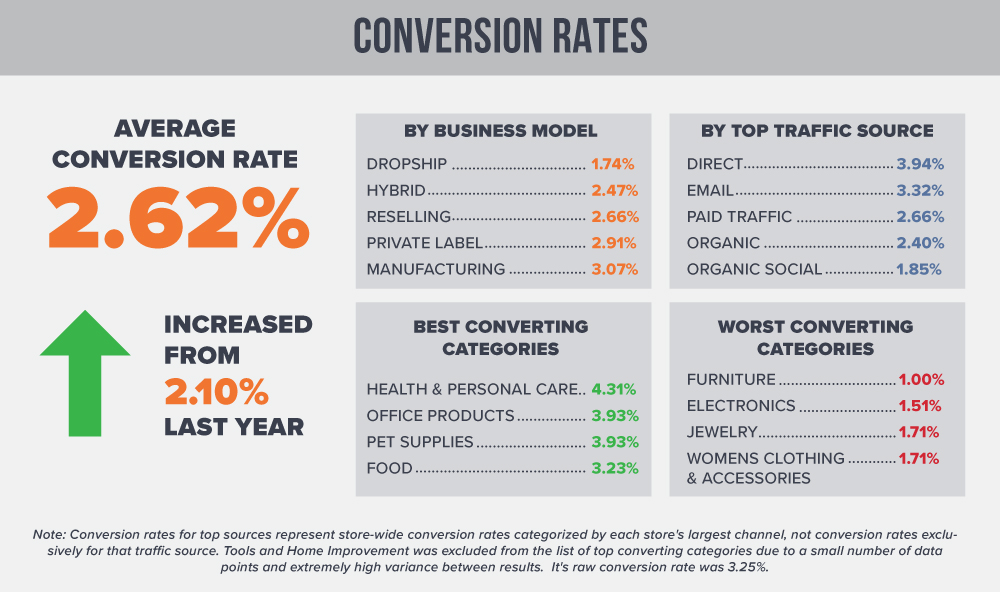
Conversion rates were the metric that surprised me the most this year. Last year’s overall conversion rate was 2.10% and it jumped to 2.62% this year, up almost 25%.
This. Is. Massive.
As any CRO will tell you, getting a 25% lift on a single site is an impressive feat. But to see a conversion boost on a macro level is just wild.
At first, I thought there was some other explanation or that I had made a mistake. Perhaps merchants had migrated in droves to higher-converting business models? From drop shipping to manufacturing?
As we talked about earlier, the distribution of people in different eCommerce models shifted but only slightly. And not nearly enough to justify the 25% boost.
So I began to look at the conversion rates across all models and saw the same thing: an increase across the board. Drop shipping conversion rates went from 1.29% to 1.74%. Proprietary manufacturing rates went from 2.33% to 3.07%. Ditto with Hybrid, Reseller and Private Label models.
Last year’s conversion rate was 2.10% and it jumped to 2.62%, up almost 25%.
To be honest, I’m not sure how to explain such a jump.
Perhaps it’s a result of the strong economic results, booming stock market and low unemployment we’re seeing in places like the U.S. With things going well, consumers are just spending more. Perhaps the larger-sized business respondents on average are more sophisticated and have better converting stores.
Or maybe the 70+ crowd is finally coming out in full force to shop online, pushing up rates everywhere! (Hmmm, less likely). Whatever the reason, it’s a great sign for 7-figure merchants.
If accurate, the jump in conversion rates might help explain why margins have stayed more-or-less the same this last year despite pressure from Amazon and upward creeping paid traffic costs.
Amazon’s Market Share is Up Sharply
We all know Amazon is growing quickly and taking over eCommerce. But exactly how quickly?
I think the most telling stat here is how much of the overall revenue merchants are generating came from Amazon vs. other channels. Using rough numbers to illustrate, of our $1 billion in collective survey revenues $200 million would have come from Amazon last year in 2017.
Revenue generated via Amazon rose 38% from last year.
One year later in 2018, that number has jumped to $276 million – a 38% jump in just one year.
Despite concerns I hear weekly from store owners worried about being overly dependent on the platform, more and more store owners are seeing Amazon become their #1 sales channel.

Amazon Margins and Relative Growth
Amazon merchants are growing at a significantly faster rate that their non-Amazon counterparts.
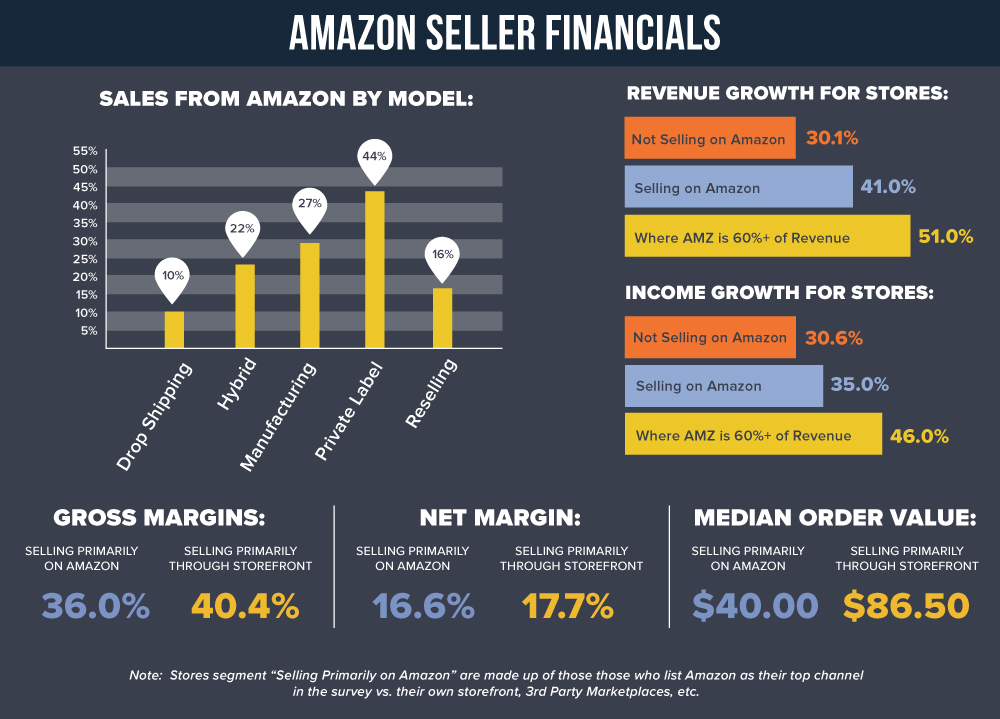
Stores predominantly selling on the behemoth are growing at over 50% annually vs. just 30% for stores not selling on Amazon at all. Income growth follows a similar trend.
Margins between on-and-off Amazon merchants are fairly close.
Margins between on-and-off Amazon merchants are fairly close too. One interesting year-over-year trend: the net margin gap between Amazon and non-Amazon sellers widened a bit this year to a full 1.1% difference vs. 0.3% last year. This is possibly due to increasing Amazon fees eroding the bottom lines of Amazon sellers.
And as you’d guess, merchants manufacturing and private labeling their own products were the type of stores that sold the most through Amazon. Given the insanely competitive nature of trying to resell commodity products, drop shippers and resellers reported the lowest levels of Amazon revenues.
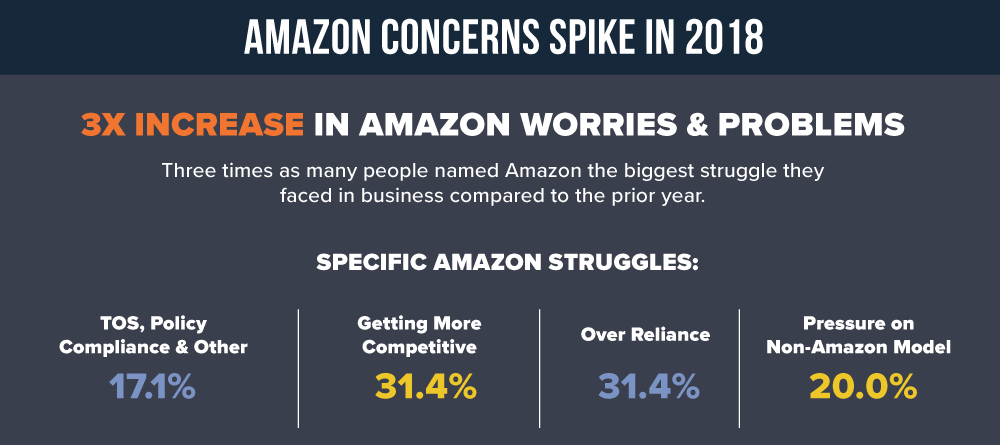
The Only Thing Growing Faster Than Amazon Revenue? Complaints.
The most fascinating Amazon takeaway is not how quickly revenue is growing via Amazon but rather the steep increase in complaints.
Amazon revenues grew roughly 40% year-over-year. But complaints about Amazon? Those grew 3x or 200% – at nearly 5x the rate of revenue reported by merchants on the platform.
Complaints about Amazon are up 3x from 2017, nearly 5 times faster than growth from the channel.
At first blush, I expected the complaints would largely be about disenfranchised drop shippers and resellers complaining they couldn’t join the Amazon gravy train. That Amazon was destroying their old-school business model.
Not the case. The vast majority of complaints were from people on Amazon complaining about doing business on the platform.
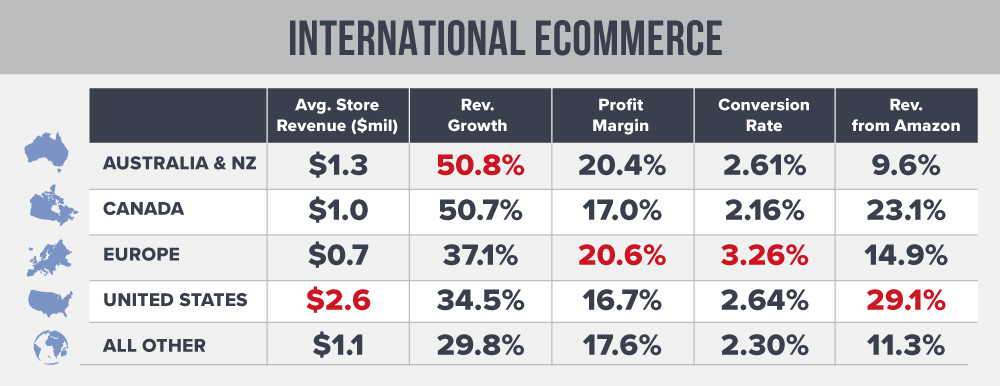
International Markets Are Looking Attractive
One theme on the podcast last year was the increasing saturation of eCommerce in the U.S. and the attractiveness of opportunities abroad. Specifically with Amazon in Europe and an increased focus on exporting to and selling in non U.S. markets.
The report data seems to paint a similar picture.
Amazon is far less ubiquitous outside the U.S. and I’d argue that the numbers listed below are even over-reported.
(Why? Of the 10% of their revenue that Australians report from Amazon, I’d guess that much comes from sales Australian merchants are doing outside the country given Amazon just launched there this fall. Private Community Members can check out the entire discussion on Amazon Australia’s launch here).
Quick glances at revenue growth rates, margins and conversion rates also reveal markets that largely seem more attractive and less competitive than the U.S. If merchants are willing to overcome some of the logistical and cultural issue involved with selling abroad it appears there are are some nice fertile fields available outside the States.
Software Trends in 2018
(Full Disclosure: Shopify, Klaviyo and Yotpo have all sponsored The eCommerceFuel Podcast and/or our live events. LiquidWeb has promoted their WooCommerce hosting solution with us as well via a podcast sponsorship).
As part of our Private Community for 7-Figure Sellers, we’ve built a proprietary software directory that tracks in real-time the software used by our 1,000+ members. Our tool scans our member’s stores on a weekly basis to determine what shopping carts, review platforms and other tools they’re using to run their stores.
We also ask our members to review the software they’re using and incorporate this into our directory. With 4,000+ software reviews submitted by our members we have a pretty good idea of how members are liking different tools.
(Interested in checking out the Software Directory? You can apply for eCommerceFuel Membership here.)
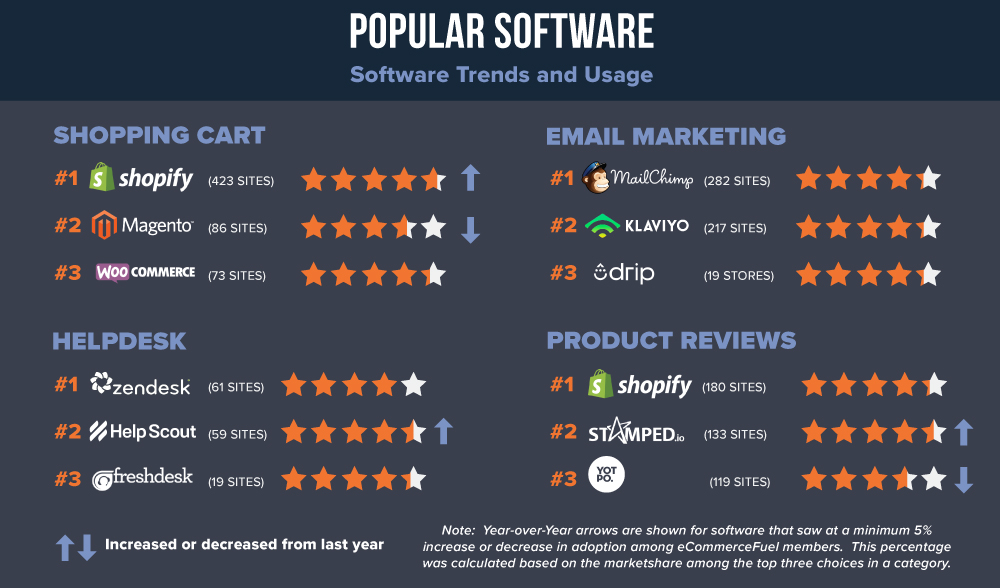
The big winners in 2018? Shopify and Stamped.io.
Shopify has continued their multi-year streak of strong growth and adoption among 7-figure store owners. Last year, they had 65% of the market share among the top three carts our members used. In 2018 that’s climbed even further to 73%. And they continue to hold the record for top satisfaction with a 4.7/5 star rating.
Shopify has continued their multi-year streak of strong growth and adoption
Stamped.io also saw a massive jump in adoption this year, more than doubling from 14% to 31% market share among the top three solutions. This was largely driven by their strong feature set and affordable pricing relative to other offerings.
The biggest losers? Yotpo and Magento.
Yotpo saw the biggest drop in adoption by our members this year sliding from 46% to 28% market share among the top 3 review tools. The biggest reason? Pricing. Members are generally very happy with their features but large pricing increases caused a lot of members to move to other solutions (like Stamped.io) and was the reason behind most negative star ratings.
Magento continued to see a modest slip in adoption, a trend that was more pronounced in previous years as many merchants (myself included) jumped ship.
Speaking anecdotally, they seemed to be moving to easier-to-administer carts like Shopify when cart and feature customization wasn’t a critical requirement of their business. My guess is that the large exodus we saw from other carts to Shopify will slow substantially in 2019 and beyond. Why?
Partially because Shopify owns so much of the market, and partially most owners remaining on other carts likely have a strong business case for doing so: custom features, unique platform strengths, etc. For a deep dive on the cart landscape you can listen to my review and thoughts on Shopify, Magento and WooCommerce in 2018.
Finally, Helpscout inched within striking distance of taking the crown from Zendesk as the #1 helpdesk and Drip made the email marketing list top three for the first time ever.
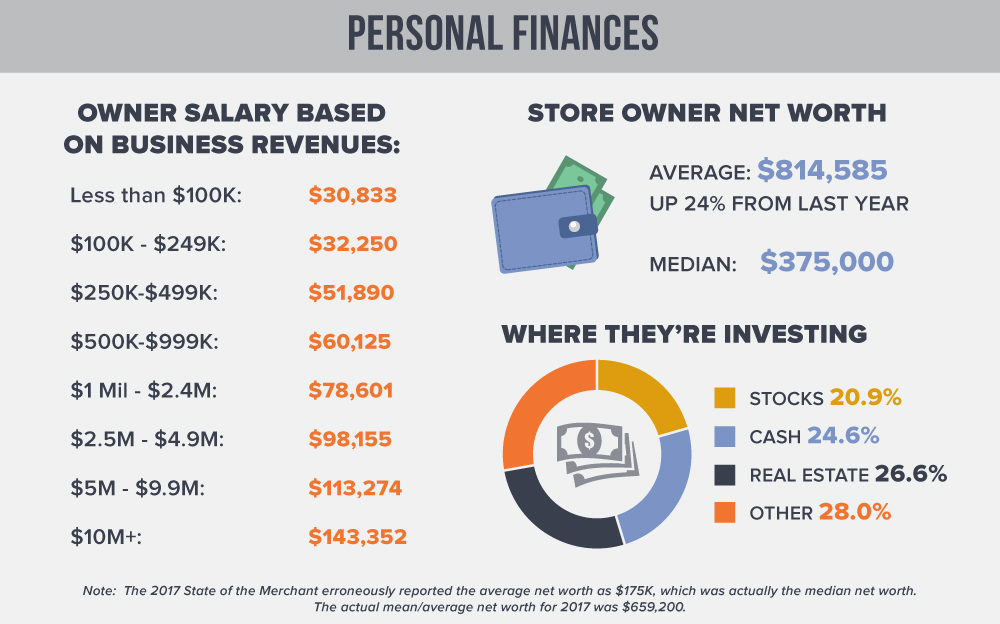
Store Owners are Getting Richer
Want to increase your net worth 24% year-over-year? Get yourself a 7-figure eCommerce store!
Existing store owners sure saw a very nice uptick in their net worth over the last year. I’d attribute this largely to the strong results discussed above. A surging U.S. stock market (up 25%) and housing market in 2017 likely didn’t hurt either.
If you’re fighting with your accountant over what a “reasonable” salary to pay yourself is, don’t worry. Below you’ll find the average salaries listed for store owners in your revenue bracket.
(For those not familiar with this issue, many company owners struggle with where to set their salaries. The lower you set it, the more tax savings you often receive. But if you set it too low, you face potential penalties from the IRS. So coming up with a reasonable salary that can be backed up when challenged by the IRS has historically been difficult.)
Maybe We’re Not All Obsessed Workaholics
The average store owner works a 47-hour week, which surprised me. There’s a lot of perks to running your own business, but reasonable hours usually aren’t considered to be one of them.
Yes, it’s a little longer than your traditional 40-hour work week. But I found it encouraging that as a group we’re not all having to put in 70+ hour work weeks – often assumed mandatory – to build and grow meaningful businesses. Awesome!
I assumed that owners of larger businesses would be working like crazy to keep up with crazy growth and needy employees. That running a high 7- or 8-figure business would just totally consume your life.
Turns out I was wrong.
I assumed running a high 7- or 8-figure business would consume your life. Turns out I was wrong.
Owners with stores over $5 million in sales worked an average of 51.7 hours per week. Yes, more hours but not nearly the workaholic figure I expected. That number didn’t change even when I looked at stores doing over $10 million in revenue!
The fact you can run an eight-figure business and still manage to have some semblance of a personal life is incredibly encouraging news.
Finally, just like we found last year, there was very little correlation between net worth and happiness or store type and happiness. It’s one thing to hear it in studies from uppity ivy-league universities, but a whole different thing to see it in the data you personally collect.
Unhappy? Starting an eCommerce store and getting rich probably isn’t going to help. Focus on nurturing and improving your relationships instead.

Access the Full Data Set
Want to double check my work? Dive for deeper insights? Use the data to write an amazing thesis and score a Ph.D? Go for it!
I’m making the raw data set from this survey available under an attribution, non-commercial license. As long as you reference and link back to eCommerceFuel, please feel free to use this data for blog posts, reports, etc.
You can download the 2018 data set here and last year’s 2017 data set here.
Thank You and Congratulations
First off, thank you to everyone who took the time to reply to the survey and made this report possible! It’s no small ask to spend 10-15 minutes of your day answering questions and I greatly appreciate your involvement. Thank you!
Each year I give away a round-trip airline ticket anywhere in the world to one lucky survey participant as a way to say thank you for being involved. This year the round-trip ticket goes to Brad Maggard of MaggardRazors.com – congratulations sir!
Last year the winner used their ticket to tour Europe. I’m excited to see where you’ll go, Brad. 🙂
A special thanks to Michael Tremeer for his help crunching this survey data and spotting interesting trends. If you’re looking for someone to help you turn data from your business into insights you can leverage to grow your business make sure to connect with him at Milu Consulting and/or checkout his own insightful post on the survey data here.
And finally, a very special thanks to Steve Chou who despite incessant moaning and whining each year about the survey’s length somehow finds the time to fill it out. I appreciate you reaching deep, Steve – thank you. You are a true friend.
Enjoy This and Want More?
If you’d like to receive an alert when we publish content here at eCommerceFuel – including next year’s 2019 State of the Merchant – you can subscribe right here.
And if you’re a high-six, seven- or eight-figure store owner and interested in joining us inside the eCommerceFuel Private Community you can learn more and apply for membership right here.
The Full Infographic
Feel free to embed or share this infographic but please attribute and link to this eCommerceFuel post. You can download the full image here.
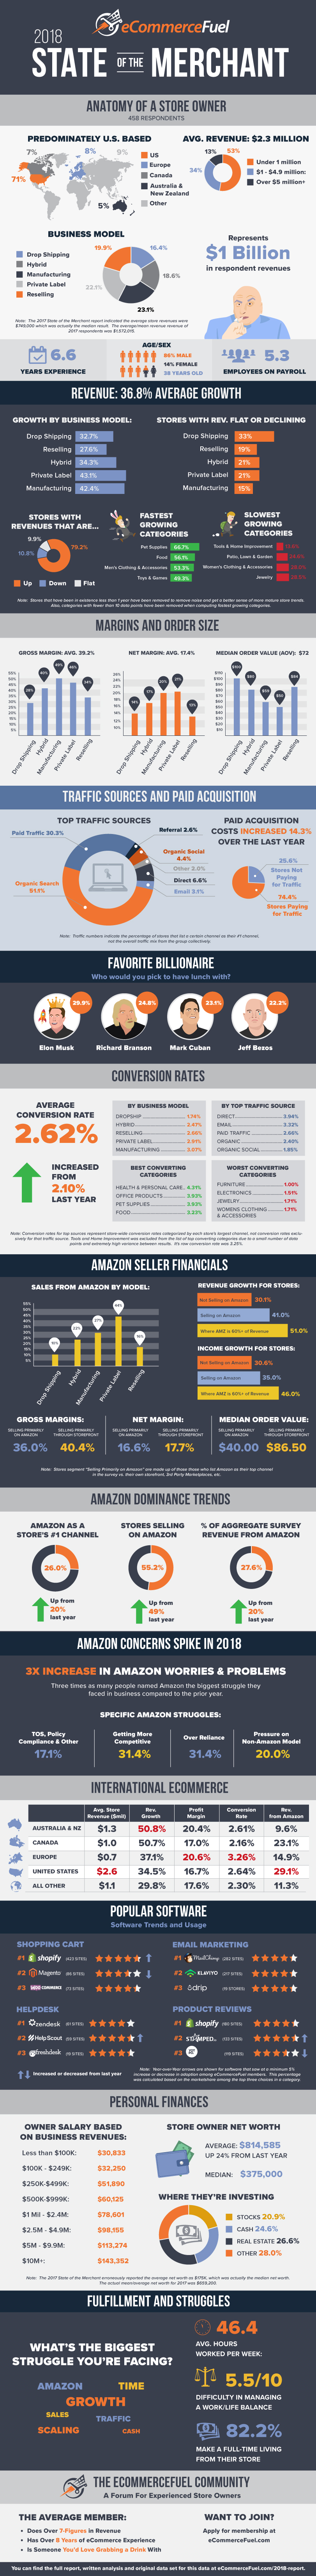
Feel free to embed or share this infographic but please attribute to eCommerceFuel. You can download the full image here.